
Timeline Waveform
Open Edit -> Preferences… and select Timeline Waveform.
Sets how audio looks on the timeline: regular waveform or spectrogram, which channel(s) to draw, and spectrogram rendering. Settings apply as you change them. Spectrogram sliders enable only when Waveform Type is Spectrogram.
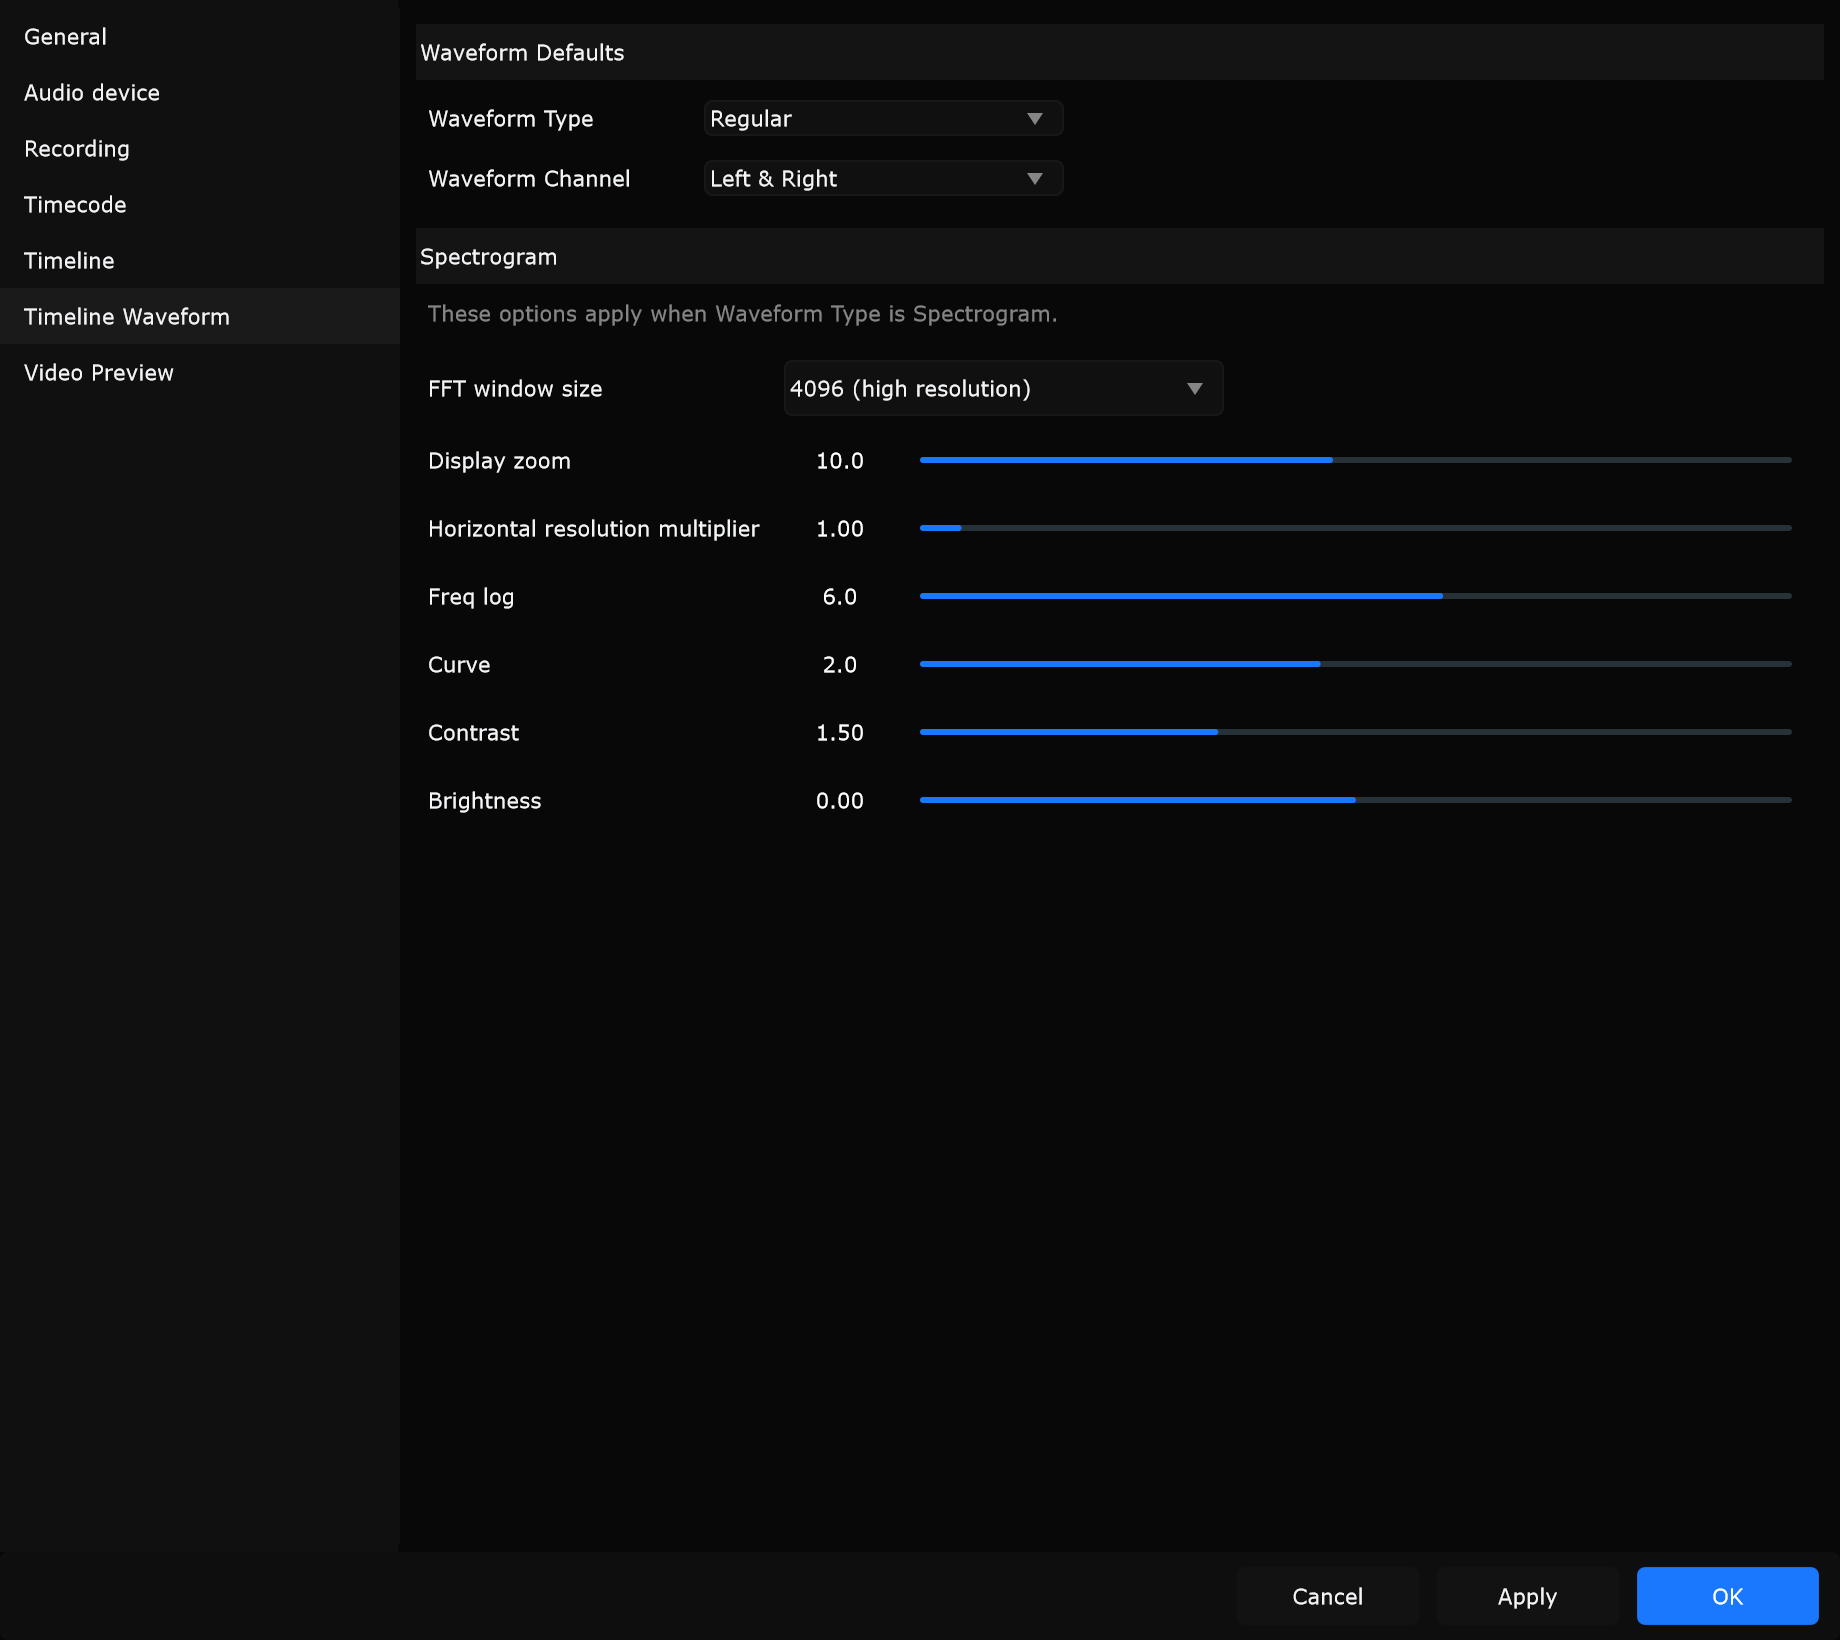
Waveform Defaults
Section titled “Waveform Defaults”Waveform Type
Section titled “Waveform Type”| Option | What you see |
|---|---|
| Regular | Amplitude waveform along the track |
| Spectrogram | Frequency content over time |
When to use: Regular for everyday editing and level judgement. Spectrogram for SFX spotting - finding breaths, tonal hits, and broadband impacts that are hard to see in a waveform.
Waveform Channel
Section titled “Waveform Channel”| Option | What it draws |
|---|---|
| Left only | Left channel |
| Right only | Right channel |
| Left & Right | Both channels |
When to use: Prefer Left & Right for stereo stems. Use a single channel when one side carries click, LTC bleed, or the stem you are labelling against.
Spectrogram
Section titled “Spectrogram”Dialog hint: These options apply when Waveform Type is Spectrogram. Controls stay visible but disabled for Regular.
FFT window size
Section titled “FFT window size”| Option | Trade-off |
|---|---|
| 2048 (standard) | Balanced time vs frequency detail |
| 4096 (high resolution) | Sharper frequency; slightly softer time edges |
| 8192 (extra resolution) | Maximum pitch detail; least precise transient timing |
When to use: Start at 2048. Move up when separating close pitches; stay at standard when transient timing of short hits matters more.
Display zoom
Section titled “Display zoom”Vertical / display scaling of the spectrogram image (1.0 to 20.0).
When to use: Raise zoom to inspect quiet detail; lower it for an overview of the full plot.
Horizontal resolution multiplier
Section titled “Horizontal resolution multiplier”How densely the spectrogram is computed along time (0.25 to 16.0). Higher is sharper when zoomed in; lower is lighter on CPU for long tracks.
When to use: Raise while spotting a short SFX region; lower for scrolling a two-hour show.
Freq log
Section titled “Freq log”How strongly frequency is mapped on a logarithmic scale (0.0 to 10.0). Higher values emphasise bass / kick structure.
When to use: Raise when kick and bass hits are the spotting targets; lower to spread high-frequency detail.
Intensity mapping curve (0.3 to 4.0).
When to use: Adjust until mid-level events read clearly without crushing peaks or hiding soft detail.
Contrast
Section titled “Contrast”Separation between quiet and loud spectral bins (0.2 to 4.0).
When to use: Increase so hits pop on a dense mix; decrease if the image looks posterised or noisy.
Brightness
Section titled “Brightness”Overall lightness of the spectrogram (-1.0 to 1.0).
When to use: Raise for dark, quiet stems; lower when the plot looks washed out. Pair with Contrast.